Antarctica Climate Data and Climate Graphs McMurdo, Amundsen-Scott (South Pole) and Vostok Stations
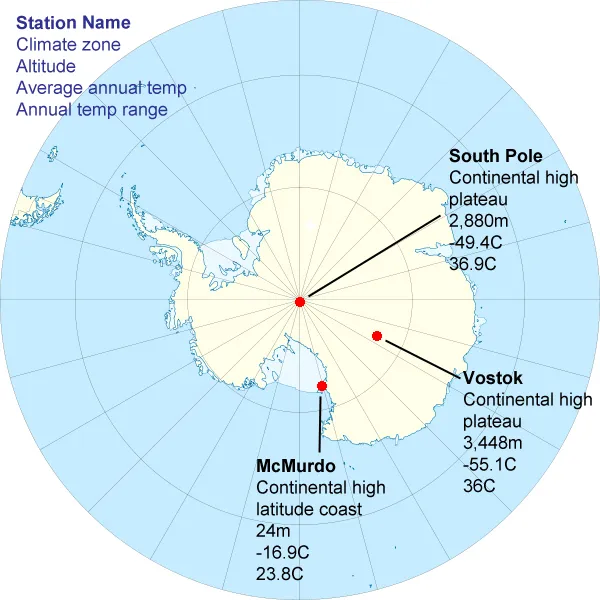
Temperature and rainfall information for stations in Antarctica. These are the three areas that are most requested. McMurdo (USA) is the most populated, the South Pole (USA) for obvious geographical reasons and Vostok (Russia) as it is near the Pole of inaccessibility, the furthest place from the ocean in any direction.

Climate data for
the American McMurdo station - Continental High Latitude Coast
Latitude: 77.88°S; Longitude: 166.73°E
Height - about 24m
/ 78 feet above sea level

| Jan | Feb | Mar | Apr | May | Jun | Jul | Aug | Sep | Oct | Nov | Dec | Annual Mean | |
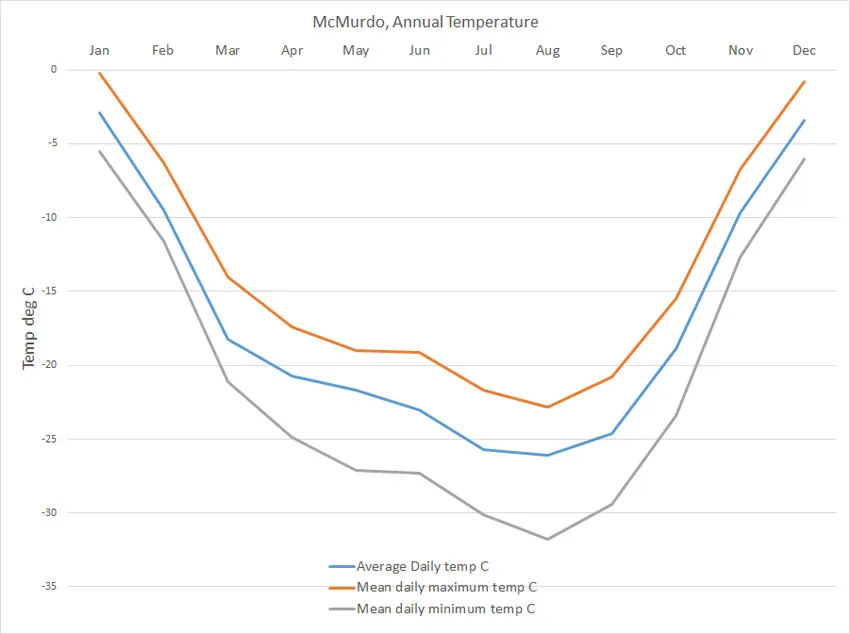
| Average daily temperature °C | - 2.9 | - 9.5 | - 18.2 | - 20.7 | - 21.7 | - 23 | - 25.7 | - 26.1 | - 24.6 | - 18.9 | - 9.7 | - 3.4 | - 16.9 |
| Mean daily max °C | - 0.2 | - 6.3 | - 14 | - 17.4 | - 19 | - 19.1 | - 21.7 | - 22.8 | - 20.8 | - 15.5 | - 6.7 | - 0.8 | - 13.5 |
| Mean daily min °C | - 5.5 | - 11.6 | - 21.1 | - 24.9 | - 27.1 | - 27.3 | - 30.1 | - 31.8 | - 29.4 | - 23.4 | - 12.7 | - 6 | - 20.6 |
| Mean monthly rainfall* mm | 15 | 21.2 | 24.1 | 18.4 | 23.7 | 24.9 | 15.6 | 11.3 | 11.8 | 9.7 | 9.5 | 15.7 | Annual total 202.5 |
McMurdo is a coastal station and so is influenced by the sea. Once the winter pack ice starts to form and the sun disappears beyond the horizon, the temperature really starts to drop. The reappearance of the sun causes the temperature to rise rapidly again.
*Rainfall figures - precipitation is given as rainfall equivalent, i.e. the amount that would have fallen had it fallen as rain and not snow. Actual liquid rain is very rare in Antarctica.
Climate data for the American Amundsen-Scott station at the South Pole - Continental High Plateau
Data range from 1957 to 1988; Latitude: 90°S; Longitude: 0

| Jan | Feb | Mar | Apr | May | Jun | Jul | Aug | Sep | Oct | Nov | Dec | Year | |
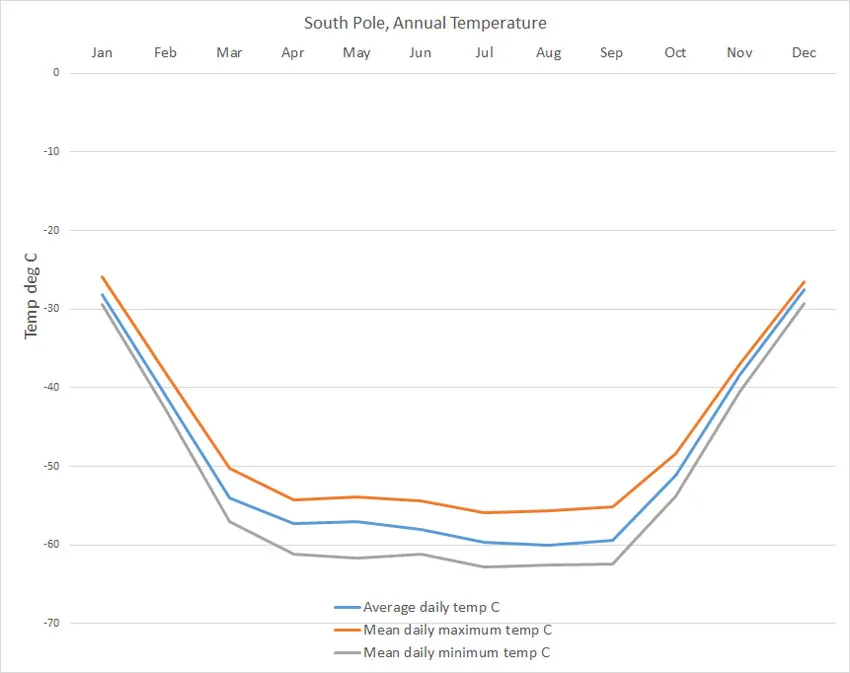
| Average daily temperature °C | - 28.2 | - 40.9 | - 54 | - 57.3 | - 57 | - 58 | - 59.7 | - 60 | - 59.4 | - 51.1 | - 38.3 | - 27.5 | - 49.4 |
| Mean daily max °C | - 25.9 | - 38.1 | - 50.3 | - 54.2 | - 53.9 | - 54.4 | - 55.9 | - 55.6 | - 55.1 | - 48.4 | - 36.9 | - 26.5 | - 45.4 |
| Mean daily min °C | - 29.4 | - 42.7 | - 57 | - 61.2 | - 61.7 | - 61.2 | - 62.8 | - 62.5 | - 62.4 | - 53.8 | - 40.4 | - 29.3 | - 49.3 |
The temperature at the South Pole station consists of 6 months when it is fairly stable from April to September. After this, there is a 3 month period where the temperature rises to a peak and then drops again. This corresponds to light and dark. When it is permanently dark, the temperature is very stable. As the sun rises higher in the sky and has more heating power, so the temperature rises. After the longest day, December 21st, the sun falls again and so does the temperature.
Climate data for the Russian Vostok station at the southern geomagnetic pole - Continental High Plateau
Data range from 1957 to 1988; Latitude: 78.45°S; Longitude: 106.80°E

| Jan | Feb | Mar | Apr | May | Jun | Jul | Aug | Sep | Oct | Nov | Dec | Year | |
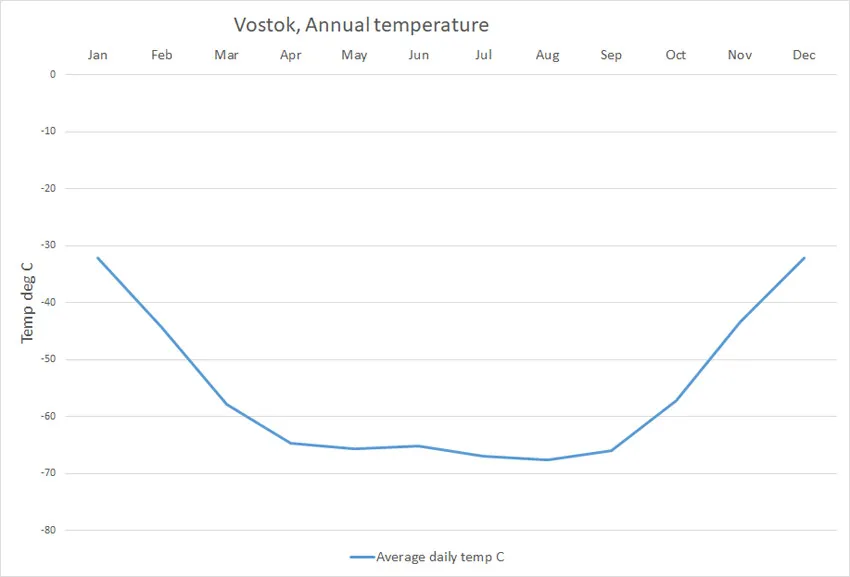
| Average daily temperature °C | - 32.1 | - 44.3 | - 57.9 | - 64.7 | - 65.6 | - 65.2 | - 66.9 | - 67.6 | - 66 | - 57.1 | - 43.3 | - 32.1 | - 55.1 |
| Mean monthly rainfall mm | 0.1 | 0 | 0.7 | 0.5 | 0.4 | 0.5 | 0.6 | 0.7 | 0.3 | 0.2 | 0.1 | 0 | Annual total 4.5 |
Vostok is at the Southern Geomagnetic Pole. It is close to the Pole of Inaccessibility, the point on the Antarctic continent that is the furthest from any other and so the most difficult or inaccessible place to get to. It is inland and on the high Antarctic ice plateau making it the coldest and most inhospitable place in the world.
Look at those rainfall figures too, total of 4.5mm a year! - 1/5th of an inch.
In cold conditions it never actually rains. The figures given are "rainfall equivalent" how much water would be produced if the snow that falls were melted.
If you want to translate these figures into degrees Fahrenheit, the data tables can be copied and dropped into an Excel spreadsheet and this formula applied:
Temperature in degrees Fahrenheit = (Temperature in degrees centigrade x 1.8) + 32
F = 1.8*C + 32
Picture credits, copyright pictures used by permission: Climates zones map - Modified from original provided by Tentotwo under Creative Commons 3.o Share and Share Alike Unported license
